5-2. The Standard Normal Distribution
标准正态分布
1. A Standard Normal Random Variable
A standard Normal Random Variable is a normally distributed random variable with mean μ=0 and standard deviation σ=1 . It will always be denoted by the letter Z : Z∼N(0,1) .
X∼N(μ,σ2)일 때, Z=σ(X−μ) 라 하면, Z∼N(0,1)이다. 즉, 정규분포를 따르는 확률변수를 표준화하면, 그 확률변수는 표준정규분포를 따른다.

2. Cumulative Probability
To compute probabilities for Z we will not work with its density function directly but instead read probabilities out of Figure "Cumulative Normal Probability" in Chapter 12 "Appendix". The tables are tables of cumulative probabilities; their entries are probabilities of the form P(Z<z) . The use of the tables will be explained by the following series of examples.
EXAMPLE 4. Find the probabilities indicated, where as always Z denotes a standard normal random variable.
P(Z<1.48) .
P(Z<−0.25) .
[ Solution ]
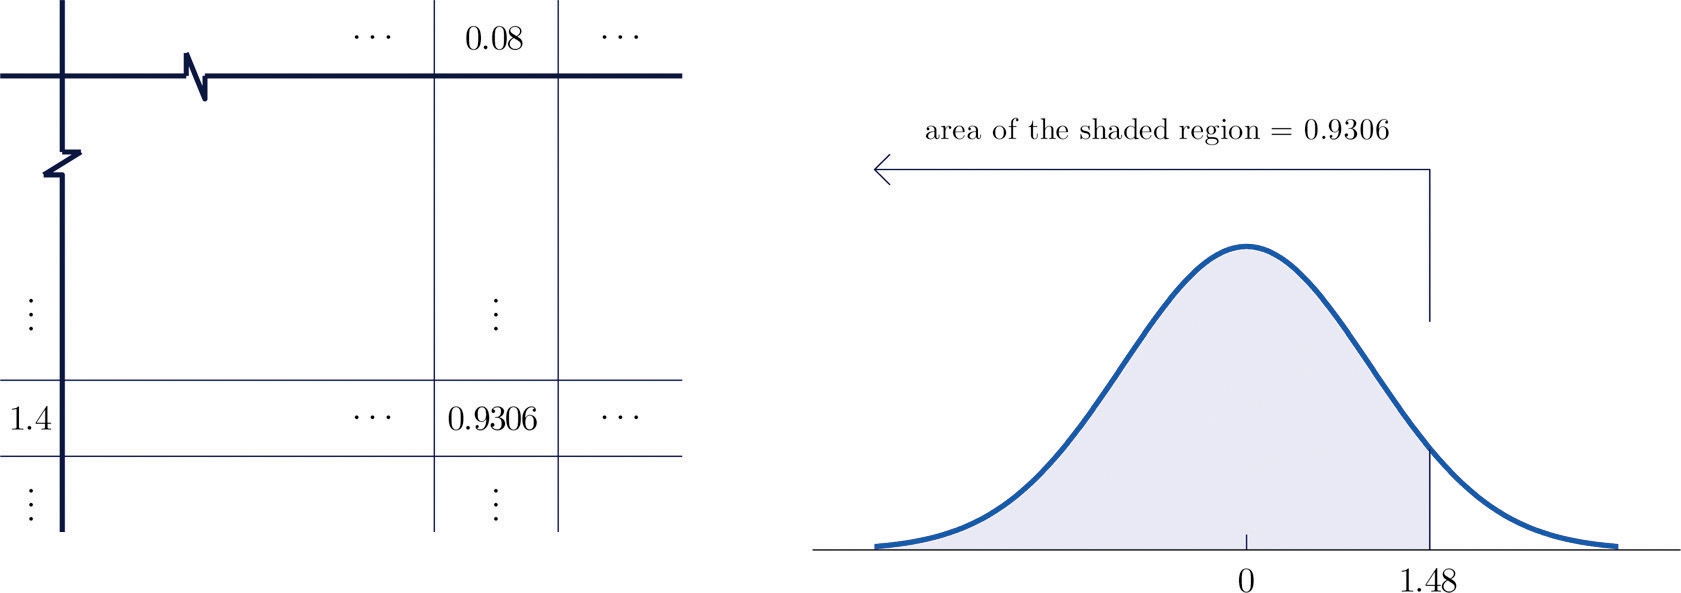
Figure 5.10 "Computing Probabilities Using the Cumulative Table" shows how this probability is read directly from the table without any computation required. The digits in the ones and tenths places of 1.48, namely 1.4, are used to select the appropriate row of the table; the hundredths part of 1.48, namely 0.08, is used to select the appropriate column of the table. The four decimal place number in the interior of the table that lies in the intersection of the row and column selected, 0.9306, is the probability sought: P(Z<1.48)=0.9306.
The minus sign in −0.25 makes no difference in the procedure; the table is used in exactly the same way as in part (a): the probability sought is the number that is in the intersection of the row with heading −0.2 and the column with heading 0.05, the number 0.4013. Thus P(Z<−0.25)=0.4013 .
Figure 5.10 Computing Probabilities Using the Cumulative Table


EXAMPLE 5. Find the probabilities indicated.
P(Z>1.60) .
P(Z>−1.02) .
[ Solution ]
Because the events Z>1.60 and Z≤1.60 are complements, the Probability Rule for Complements implies that P(Z>1.60)=1−P(Z≤1.60). Since inclusion of the endpoint makes no difference for the continuous random variable Z , P(Z≤1.60)=P(Z<1.60) , which we know how to find from the table. The number in the row with heading 1.6 and in the column with heading 0.00 is 0.9452. Thus P(Z<1.60)=0.9452. so P(Z>1.60)=1−P(Z≤1.60)=1−0.9452=0.0548. Figure 5.11 "Computing a Probability for a Right Half-Line" illustrates the ideas geometrically. Since the total area under the curve is 1 and the area of the region to the left of 1.60 is (from the table) 0.9452, the area of the region to the right of 1.60 must be 1−0.9452=0.0548.

2. The minus sign in −1.02 makes no difference in the procedure; the table is used in exactly the same way as in part (a). The number in the intersection of the row with heading −1.0 and the column with heading 0.02 is 0.1539. This means that P(Z<−1.02)=P(Z≤−1.02)=0.1539, hence P(Z>−1.02)=1−P(Z≤−1.02)=1−0.1539=0.8461


EXAMPLE 6. Find the probabilities indicated.
P(0.5<Z<1.57).
P(−2.55<Z<0.09).
[ Solution ]
P(0.5<Z<1.57)=P(Z<1.57)−P(Z<0.50)=0.9418−0.6915=0.2503

2. P(−2.55<Z<0.09)==P(Z<0.09)−P(Z<−2.55)=0.5359−0.0054=0.5305


EXAMPLE 7. Find the probabilities indicated.
P(1.13<Z<4.16).
P(−5.22<Z<2.15).
[ Solution ]
1.P(1.13<Z<4.16)==P(Z<4.16)−P(Z<1.13)=1.0000−0.8708=0.1292
2.P(−5.22<Z<2.15)=0.9842−0.0000=0.9842


EXAMPLE 8. Find the probabilities indicated.
P(−1<Z<1).
P(−2<Z<2).
P(−3<Z<3).
[ Solution ]
1.P(−1<Z<1)=0.8413−0.1587=0.6826
2.P(−2<Z<2)=0.9772−0.0228=0.9544
3.P(−3<Z<3)=0.9987−0.0013=0.9974


3. Plotting Probability Curves using R
You may, on some occasion, want to plot a curve or probability distribution. Here are a couple of approaches to plotting a standard normal curve but, they can be used for other probability distributions. The first comes from Tomas Aragon, the second from John Fox.
3-1. using the sequence operator
This approach uses the normal probability formula…
f(x)=2πσ21e2σ2−(x−μ)2
… over a sequence of values.

3-2. another approach
Here, we use the dnorm()function and add a few bells and whistles.

3-3. Cumulative Normal Distribution, X ~ N(0,1)

标准正态分布 Standard normal distribution 累积分布函数 Cumulative Distribution function(c.d.f)
Last updated