5-4. Areas of Tails of Distributions
密度曲线的尾部
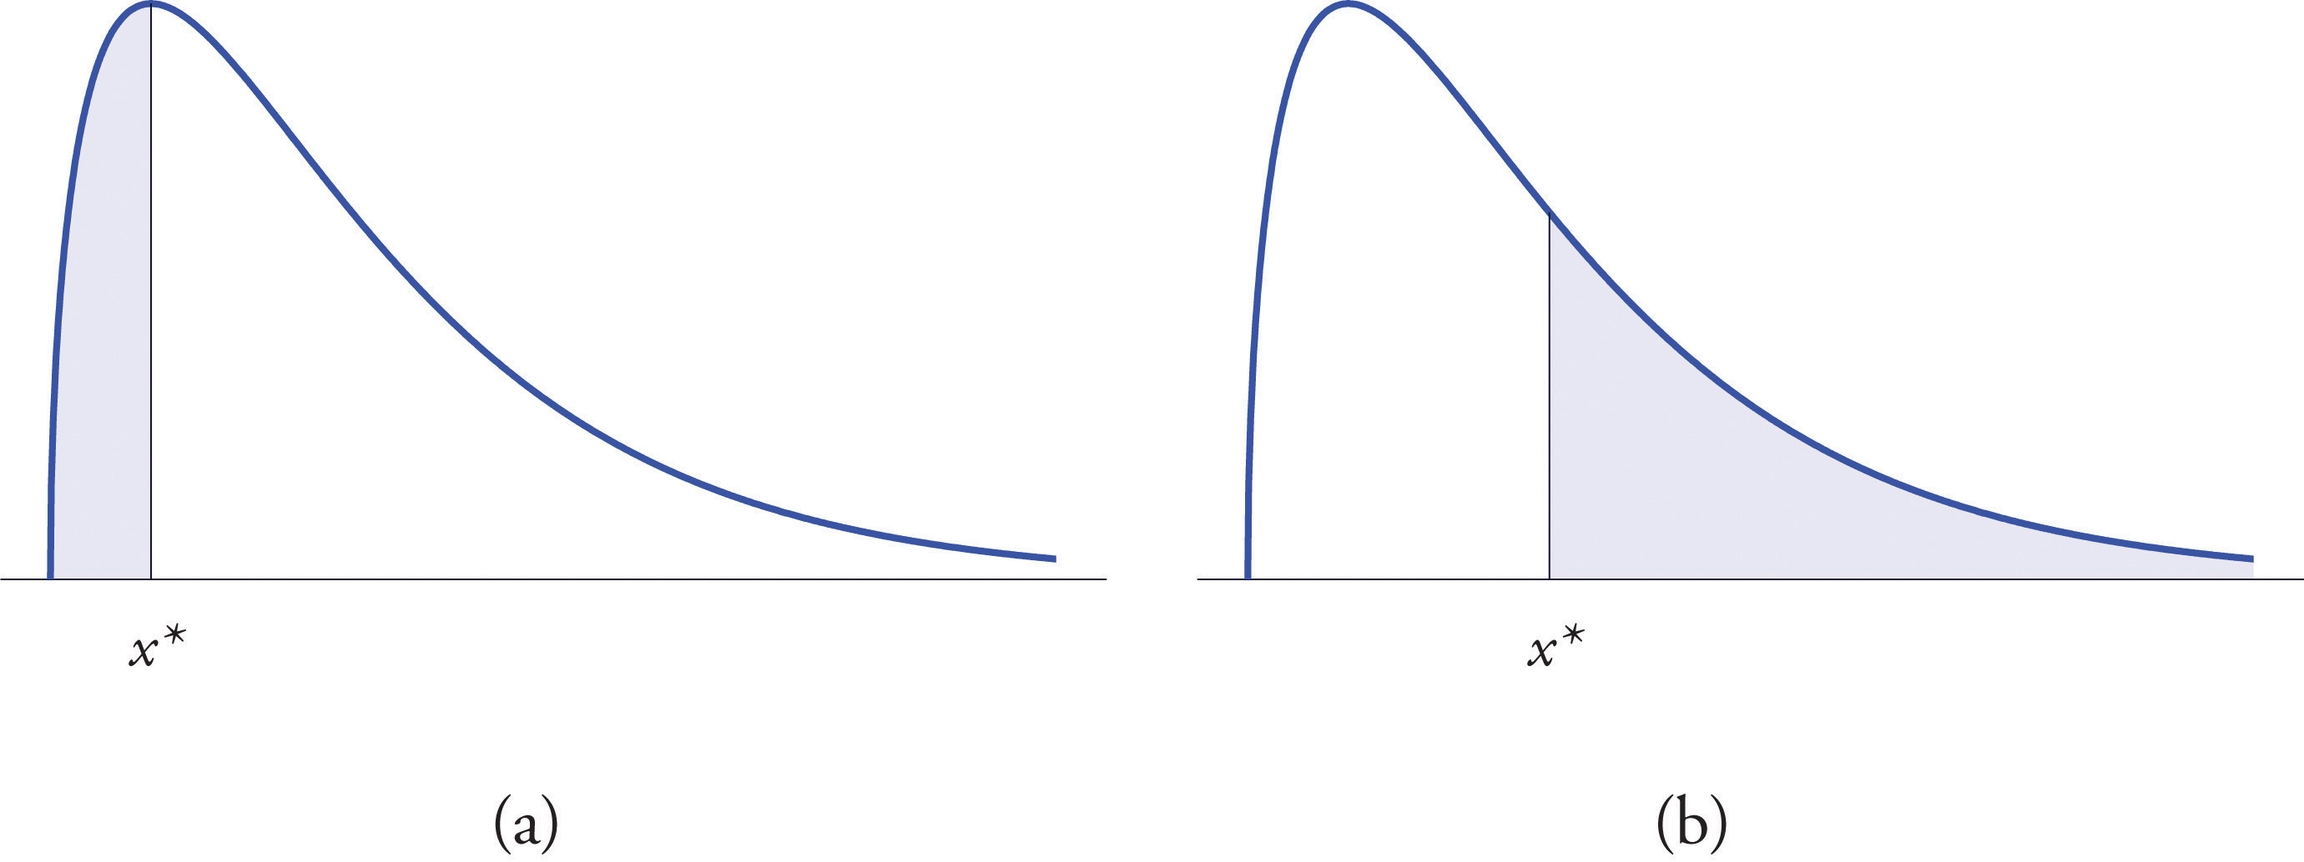
The left tail of a density curve y=f(x) of a continuous random variable X cut off by a value x∗ of X is the region under the curve that is to the left of x∗ , as shown by the shading in Figure "Right and Left Tails of a Distribution" (a). The right tail cut off by x∗ is defined similarly, as indicated by the shading in Figure "Right and Left Tails of a Distribution" (b).

1. Tails of the Standard Normal Distribution
At times it is important to be able to solve the kind of problem illustrated by the figure as follows. We have a certain specific area in mind, in this case the area 0.0125 of the shaded region in the figure, and we want to find the value z∗ of Z that produces it. This is exactly the reverse of the kind of problems encountered so far. Instead of knowing a value z∗ of Z and finding a corresponding area, we know the area and want to find z∗. In the case at hand, in the terminology of the definition just above, we wish to find the value z∗ that cuts off a left tail of area 0.0125 in the standard normal distribution.

EXAMPLE 17. Find the value z∗ of Z as determined by the above figure: the value z∗ that cuts off a left tail of area 0.0125 in the standard normal distribution. In symbols, find the number z∗ such that P(Z<z∗)=0.0125.
[ Solution ]

EXAMPLE 18. Find the value z∗of Z as determined by Figure : the value z∗ that cuts off a right tail of area 0.0250 in the standard normal distribution. In symbols, find the number z∗ such that P(Z>z∗)=0.0250.

[ Solution ]
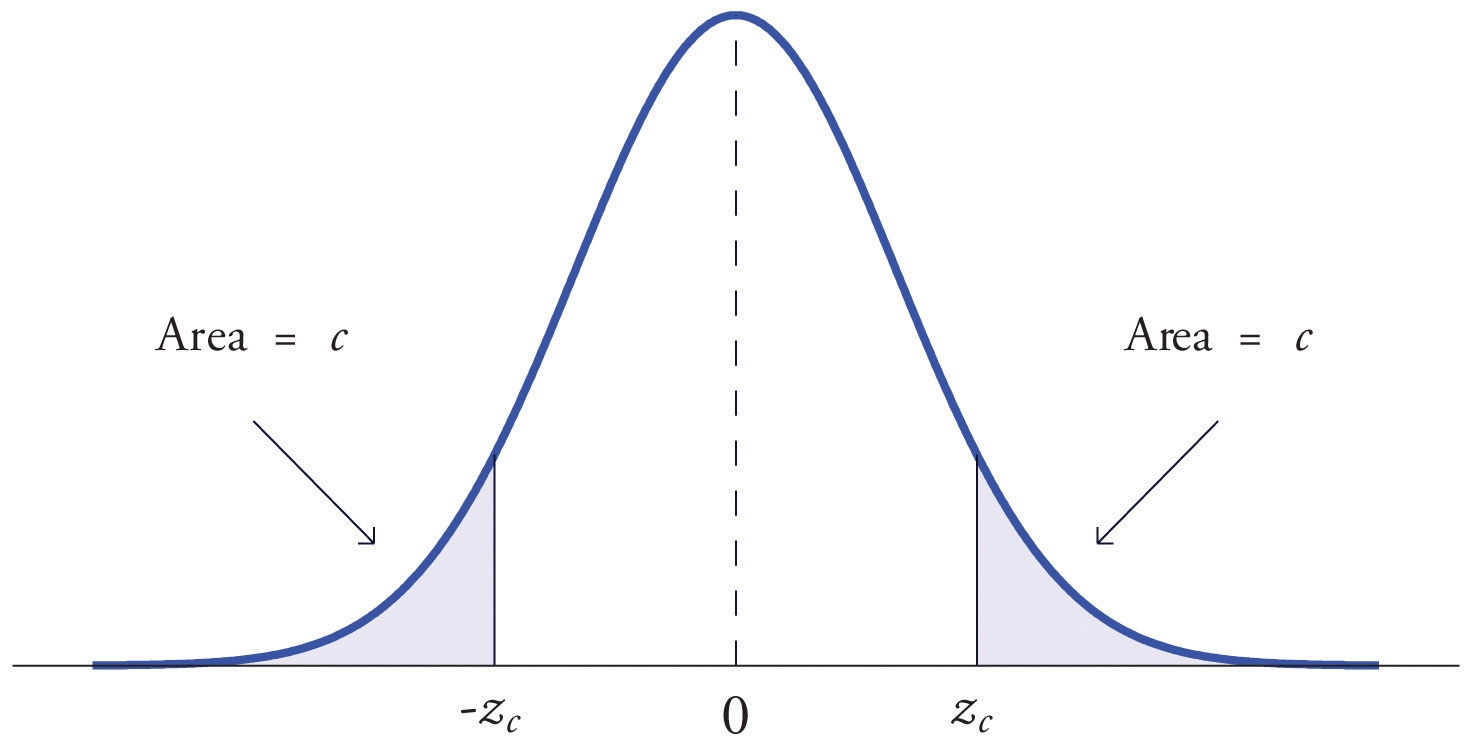
The value of the standard normal random variable Z that cuts off a right tail of area c is denoted zc . By symmetry, value of Z that cuts off a left tail of area c is −zc. See the below "The Numbers ".


EXAMPLE 19. Find z.01 and −z.01 , the values of Z that cut off right and left tails of area 0.01 in the standard normal distribution.
[ Solution ]


2. Tails of General Normal Distributions
Suppose X is a normally distributed random variable with mean μ and standard deviation σ . To find the value x∗ of X that cuts off a left or right tail of area c in the distribution of X :
find the value z∗ of Z that cuts off a left or right tail of area c in the standard normal distribution;
z∗ is the z-score of x∗; compute x∗ using the destandardization formula x∗=μ+z∗σ
EXAMPLE 20. Find x∗ such that P(X<x∗)=0.9332 , where X is a normal random variable with mean μ=10 and standard deviation σ=2.5 .
[ Solution ]


EXAMPLE 21. Find x∗ such that P(X>x∗)=0.65 , where X is a normal random variable with mean μ=175 and standard deviation σ=12 .
[ Solution ]


EXAMPLE 22. Scores on a standardized college entrance examination (CEE) are normally distributed with mean 510 and standard deviation 60. A selective university decides to give serious consideration for admission to applicants whose CEE scores are in the top 5% of all CEE scores. Find the minimum score that meets this criterion for serious consideration for admission.
[ Solution ]


EXAMPLE 23. All boys at a military school must run a fixed course as fast as they can as part of a physical examination. Finishing times are normally distributed with mean 29 minutes and standard deviation 2 minutes. The middle 75% of all finishing times are classified as “average.” Find the range of times that are average finishing times by this definition.
[ Solution ]


3. Using qnorm() and pnormGC in R
X~ norm(μ,σ)
1) find z∗ or x∗
qnorm(p, mean = , sd = )
2) plotting (See 5-3. pnormGC())
pnormGC(p, region= , mean=, sd =, graph = )
EXAMPLE 24. P(Z<z∗)=0.0125.

EXAMPLE 25. Find x∗ such that P(X<x∗)=0.9332 , where X is a normal random variable with mean μ=10 and standard deviation σ=2.5 .

密度曲线的尾部 tail of a density curve 一般正态分布 General Normal Distributions
Last updated